
Optimizing the Studio Listening Environment
by Bob HodasFigure 2
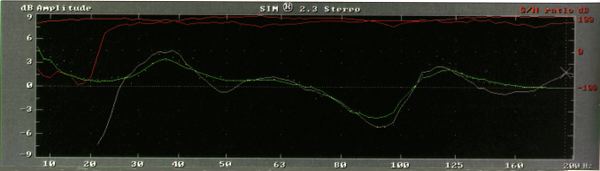
Parametric EQ correction of low-end problem (inverse of EQ shown). White trace is frequency response; green trace is EQ inversed.
Home - Publications - The Process - Clients - Testimonials - About Bob Hodas
Produced by Bob Hodas
Copyright © 1998 Bob Hodas Acoustic Analysis
All rights reserved